Software Development
LOCAL CANADIAN COVID-19 REPORTED CASE TRACKER (DJANGO WEBSITE) | APRIL 2020 - PRESENT
- Built a single page Django website (www.virihealthlocal.com) to generate local charts of both reported cases and reported deaths across the country. This involved implementing two function based views, one for the home page and one for the implementation of ChartJS to plot the local charts. The website is deployed via a Digital Ocean droplet.
- Initially, I was mining data from www.virihealth.com, via a Python Selenium Chomedriver script, and storing the data in a Mongo DB. As of April 28th, Viri Health chose to discountinue their website. At that point, I began mining the provincial and local websites, all of whom provide at least basic case details for their respective local health regions.
- Have written and executed basic unit test scripts for each page and the charts.
- Currently, am updating the templates, urls, tests and views to add a contact page as well.
EUROPEAN FOOTBALL SEER WEB (REACT) & MOBILE APP (REACT NATIVE) | DECEMBER 2018 – PRESENT
- The objective of this application is to aid sports betting by calculating probabilities of wins/losses/draws for upcoming match fixtures between any pair of European football teams.
- Have developed Python Selenium Webdriver code to mine sufficient statistics and scheduling information from WhoScored.com, to calculate the current form of players of different European teams, and store the data in an MySQL database and in JSON format.
- Currently writing more Python code to use feature engineering and machine learning to develop the best prediction models.
- Have developed an Adobe XD wireframe and currently a React Native application for predictions, along with significant insights into individual player and team performances over the past 3 seasons.
- Via SCP and an EC2 instance, I have migrated the MySQL database to Amazon RDS.
- Using Docker, I created a package for the AWS Lambda function that executes the web scraping tasks, along with fetching all dependencies. After a successful script run on Docker, I uploaded a ZIP file of the function and dependencies to Lambda.
- Have set up VPCs, Subnets, Route Tables, IGWs and NAT Gateways to allow the Lambda function access to the RDS database, particular files in an S3 bucket and the internet to successfully use Chromedriver.
- Have written a backend Node.js REST API with Express to connect to the AWS RDS, which contains the various competition and team schedules, and to the S3 bucket containing associated player statistics in JSON format.
Current App Wireframes for an IPhone X/XS/11 Pro
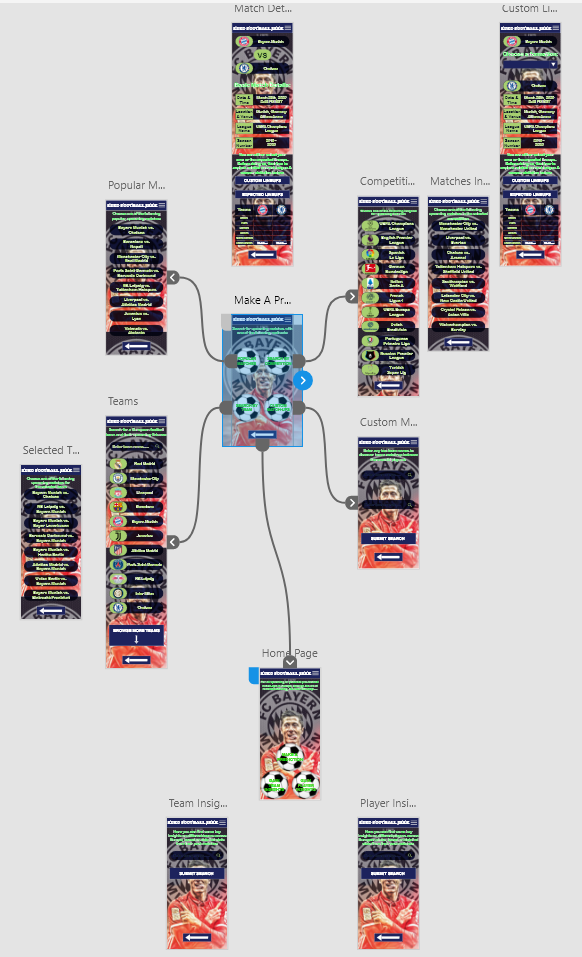 Figure 1. Current Layout
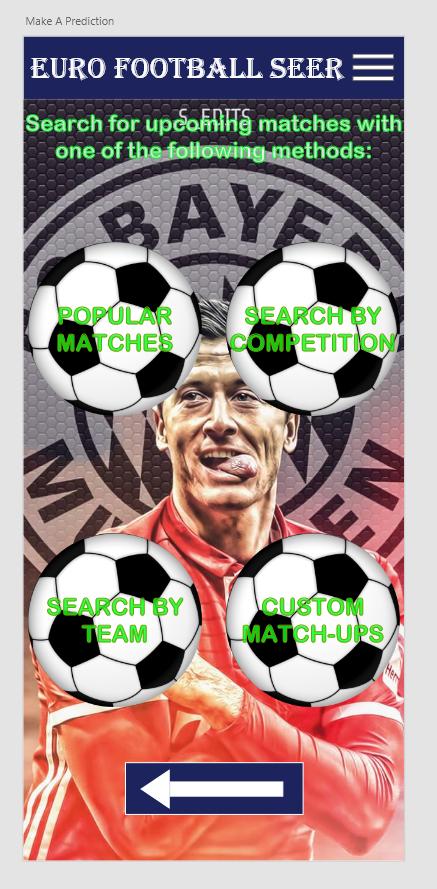 Figure 2. Main Page
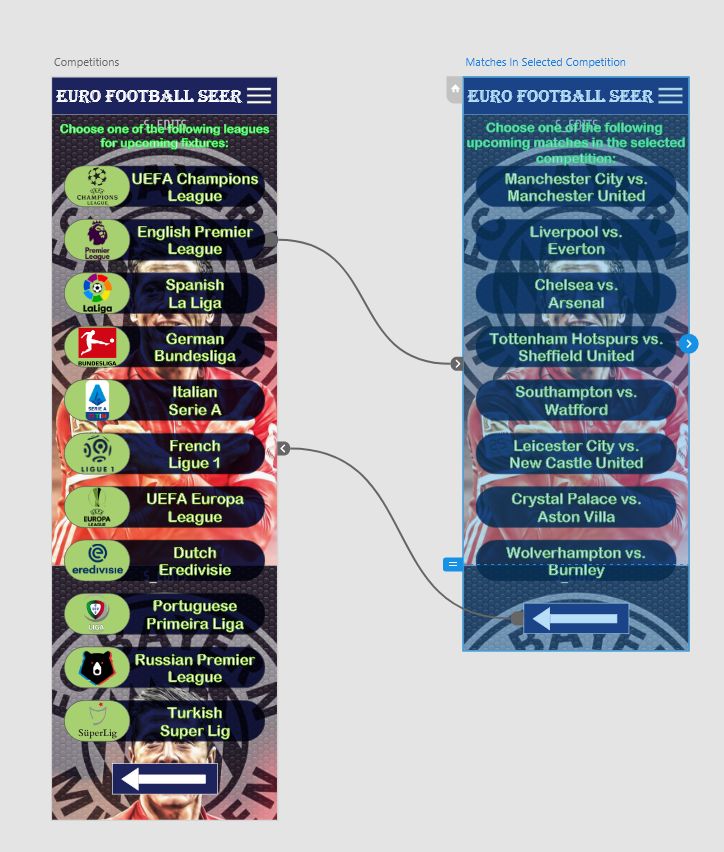 Figure 3. Competition and Match Listings
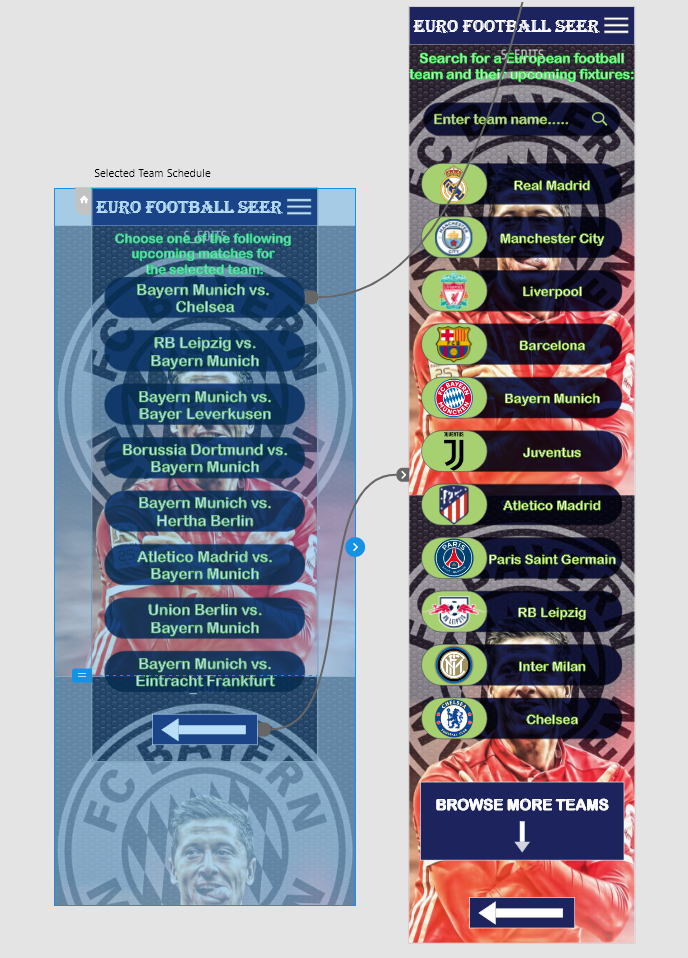 Figure 4. Team Schedule Listing
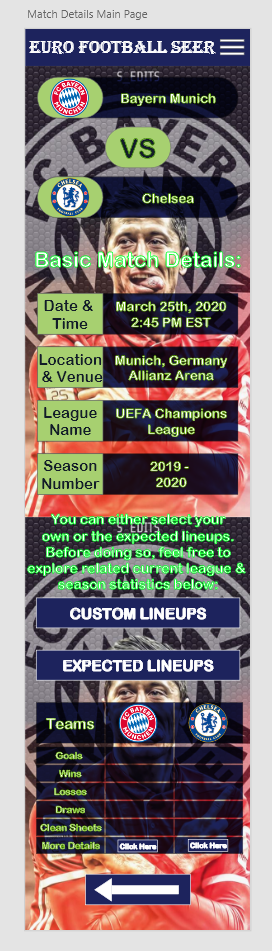 Figure 5. Basic Match Details
MY HISTORICAL NETFLIX TASTE TREND (VIA TABLEAU & PYTHON)| JANUARY 2020 - PRESENTT
- To find out the name of a show I had watched a few years ago on Netflix, I took a look at an Excel sheet downloaded from my Netflix account. I then got curious and wondered how my taste across different genres has changed since I started using Netflix.
- Due to the large amount of individual viewings (at least 1600 since 2017), I scraped the individual show names from the sheet, followed by a Python Selenium Chromedriver script that scraped, from Wikipedia, the genres of the each show.
- I am currently exploring the different visualization options available in Tableau to display my trend in genre taste based on my Netflix viewing since 2017. I also plan on exploring different Python libraries, like Matplotlib and Pandas, to display the trend, and mainly to see which set of visualization tools I might find simpler to use for future data science related work.
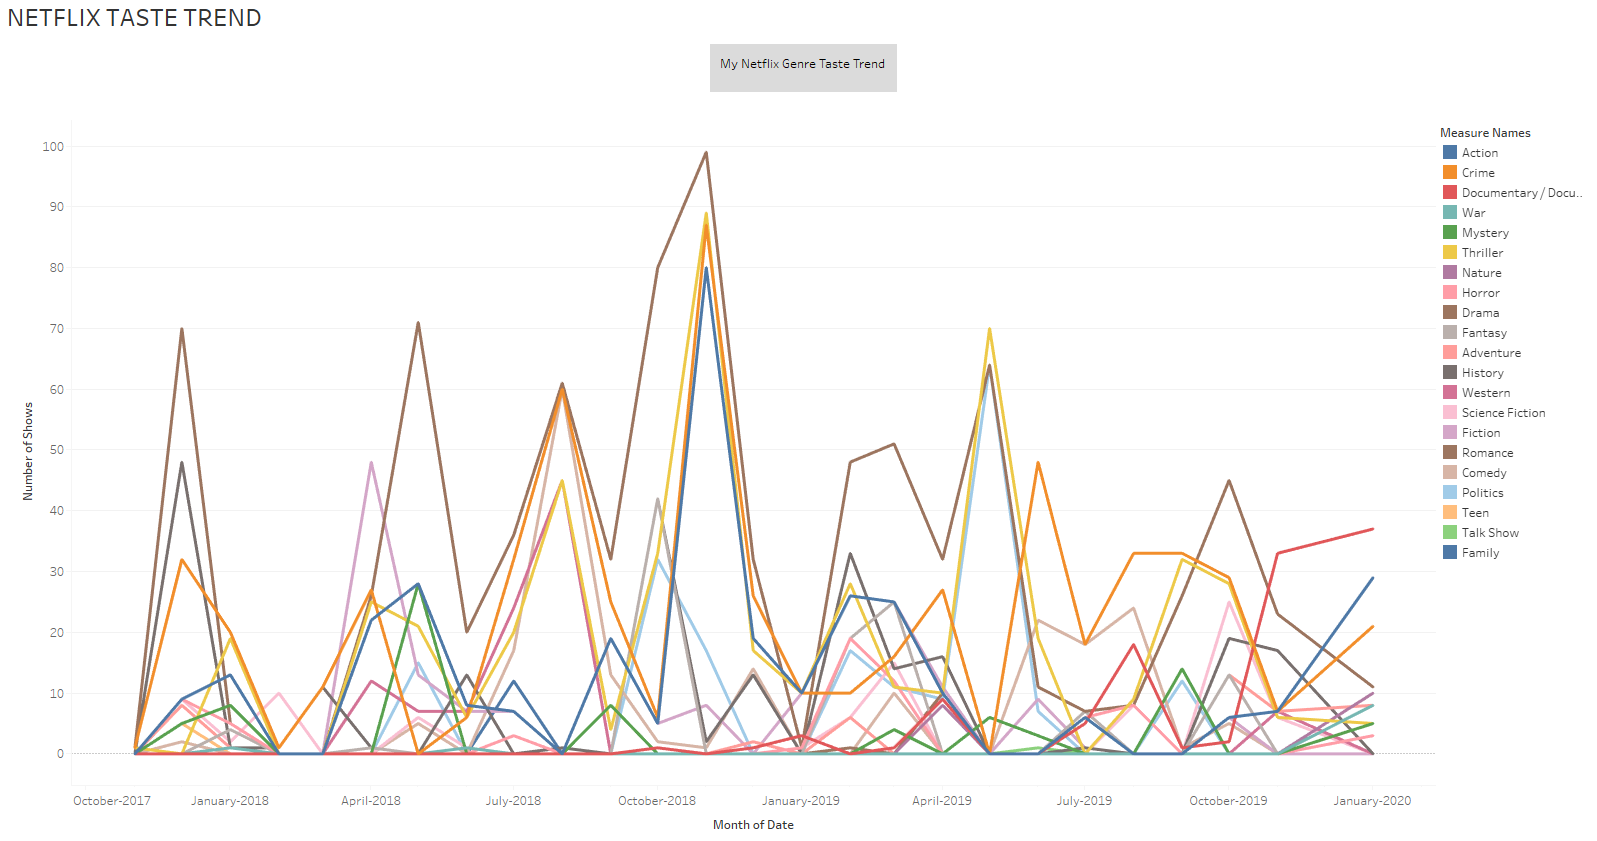
Figure 1. My Netflix Trend Plot - Tableau
HOUSEBUILDERREVIEWS.COM (ASP.NET WEB APPLICATION) | FREELANCER.COM | JULY 2019 – PRESENT
- Developed an ASP.NET web application to allow home owners and renters to enter property review surveys and storing the entered data in an SQL Server database for future home seekers to view, along with an admin interface to access and use the stored data.
- It generates leads via review data and internet cookies and monitors activity on the website in general.
- Implemented various web APIs, like Google Maps, Gmail, SendGrid, etc., via HTTP requests and similar API calls.
- Via the admin account, automated Excel document reports of different builders based on individual scores from property reviews, location, etc, can be generated.
- Initially deployed both the website design and script files via Visual Studio, and the database via SQL Server Management Studio, on Azure, and then migrated all of the website design and script files and database from Azure to Plesk for web hosting.
- Currently am working on SEO for the website (e.g., logo design with Photoshop, slideshows on the home page of home quality issues, etc.)
- Have installed Facebook pixel and Google Analytics JS code into the web pages to track activity on the website via Facebook ads and general visits to the website.